Tikal-25 Manual - Statistics View
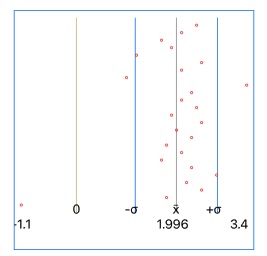
The statistics view tab shows a graphicla representation of the statistical samples entered and the mean, standard deviation and variance results. The function graph above should look something like this:
On the x axis shows the range of the sample values, with the first sample at the top and the last entered at the bottom. When the range includes 0, it is drawn as a lign in the accent color. The other lines are for the arithmetic mean x̅, standard deviation values for x̅+σ,x̅-σ and the variance.
Not all of these indicators may be visible.
Below the graph display is a textual display of the results and a list of the entered samples.

